Do you want to hack Apache Mynewt but do not know which IDE to use? Here is a short tutorial on how to configure Eclipse for working with Mynewt.
Using this setup you will have nicely working code indexer, integrated debugger and some other tools. Actually you will probably not need to use console anymore except for project configuration 🙂
Before you start, make sure you have Mynewt environment set properly and Eclipse CDT installed. This tutorial was created with Eclipse 4.21 (2021-09), but previous versions should work as well.
And final important note: it was tested on develop branch only.
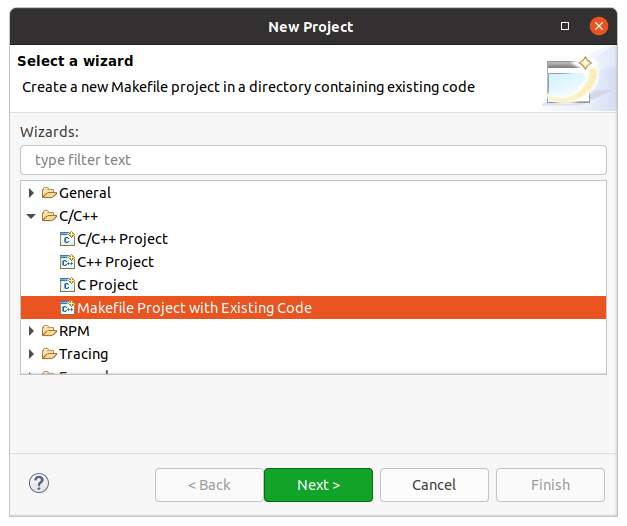
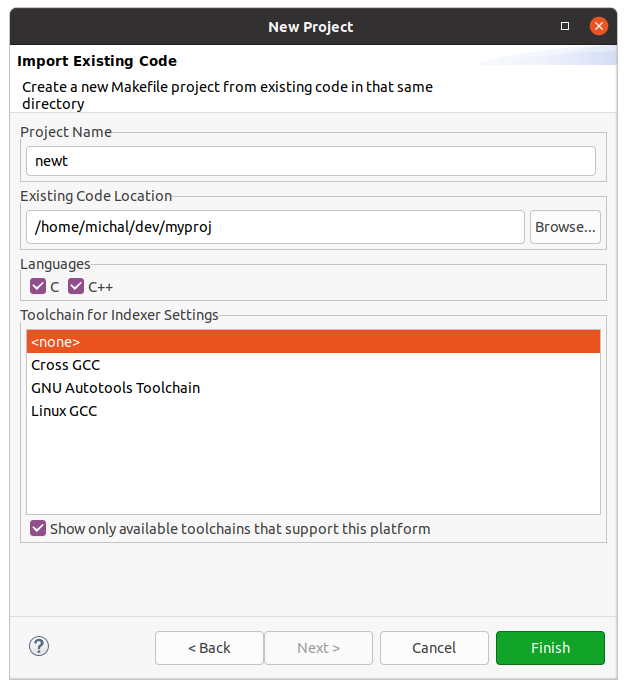
First, you need to create new project in Eclipse:
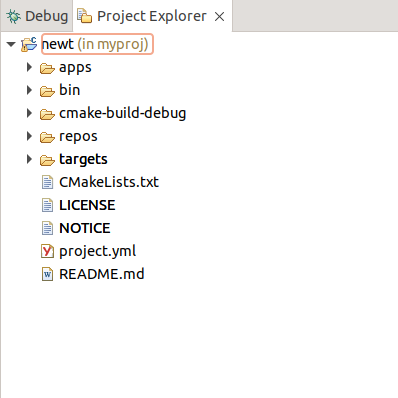
Now you should see your project in Project Explorer window.
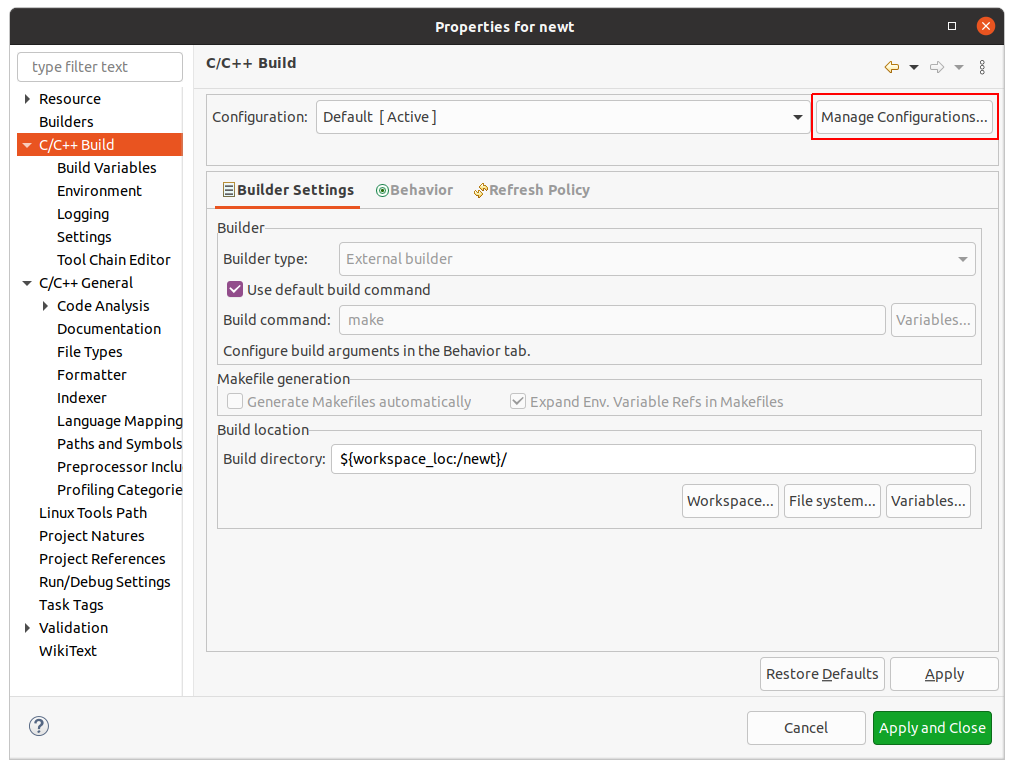
I recommend to change default build configuration name to one matching target name in your Newt project. This makes working with multiple targets easier later in the process, but you can skip this if you e.g. work with only one target. In this case remember to adjust configuration accordingly (I mention this in the description where applicable). Build configurations name can be changed by going to Project → Propertes → C/C++ Build → Manage Configurations...:
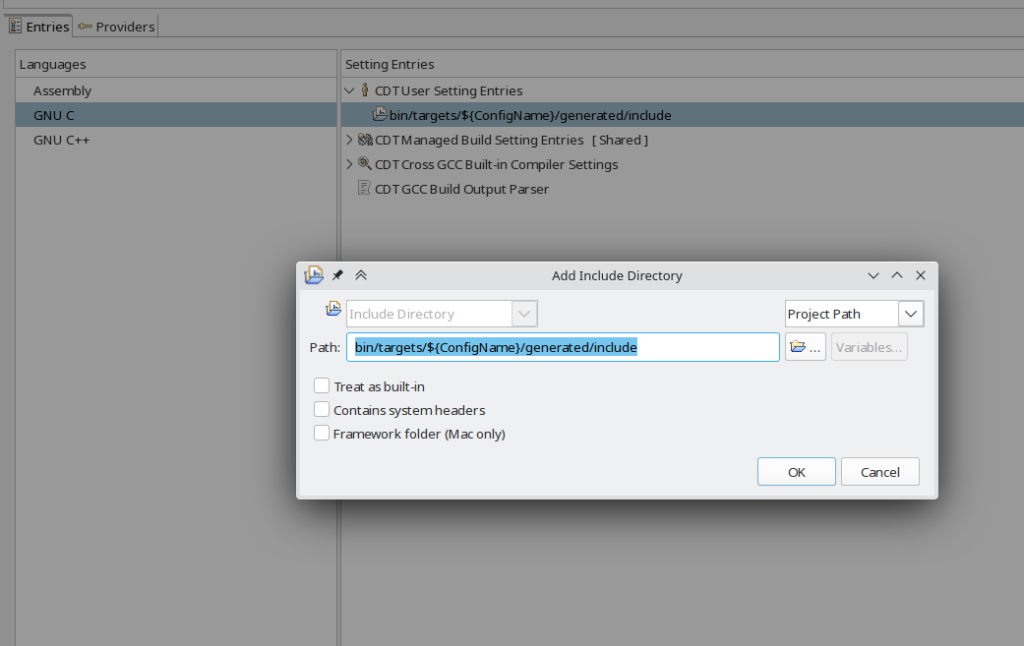
Now we can setup new project to build and index properly:
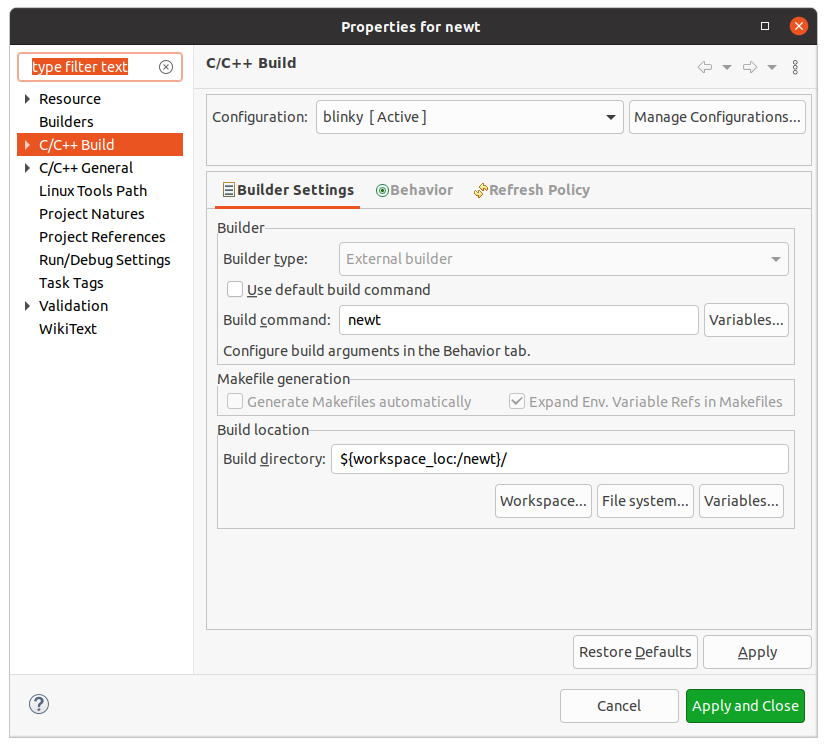
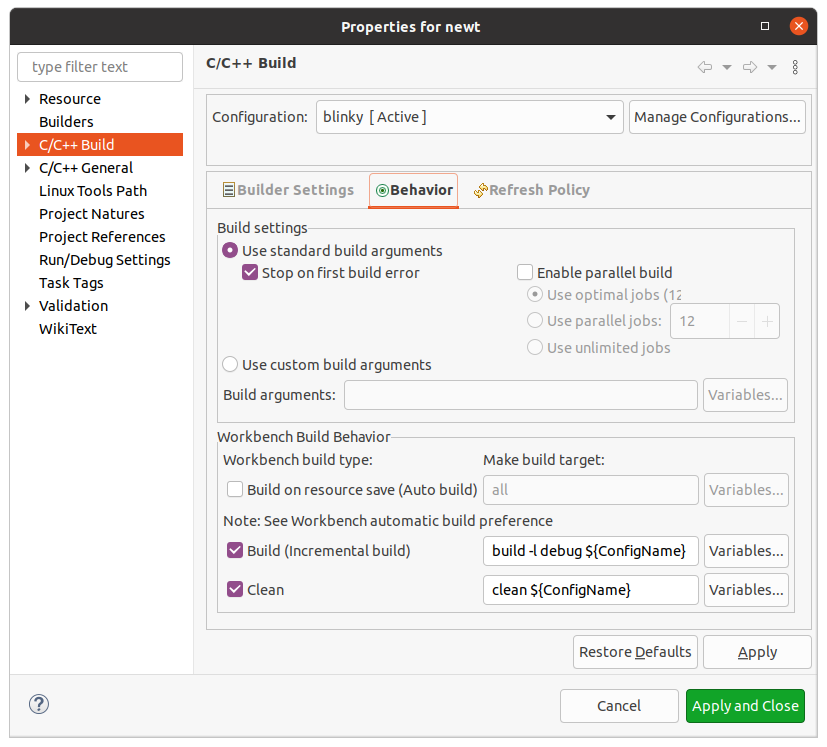
${ConfigName} will be replaced with the name of current build configuration so this will only work if you named build configurations as I suggested at the beginning. If you decided not to do this, simply replace ${ConfigName} with any valid target of your Newt project.
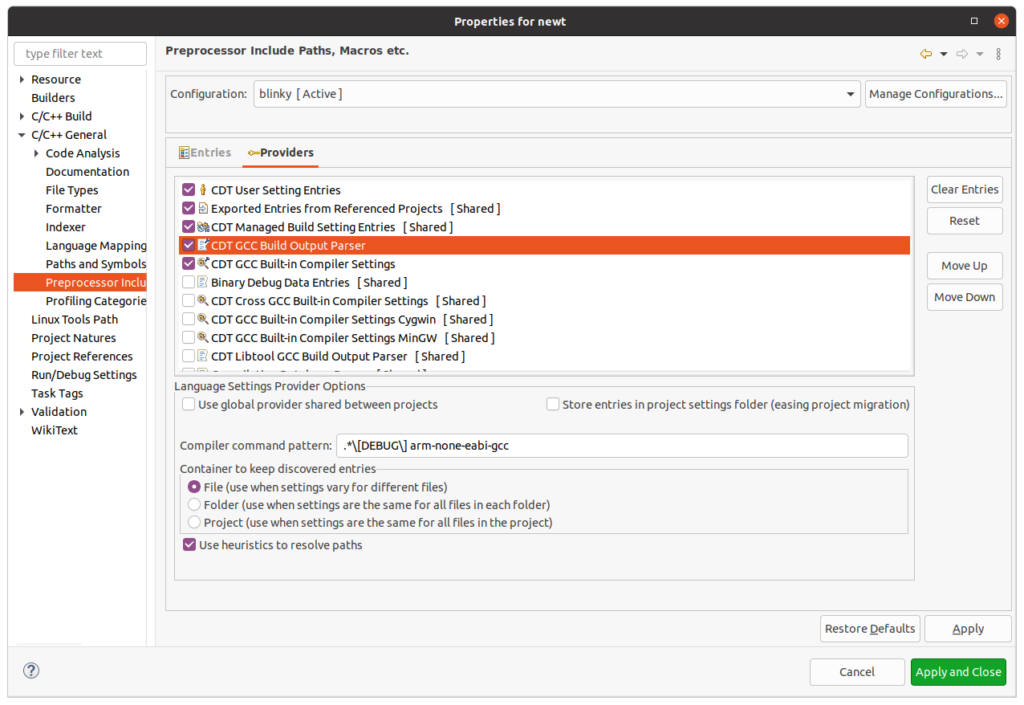
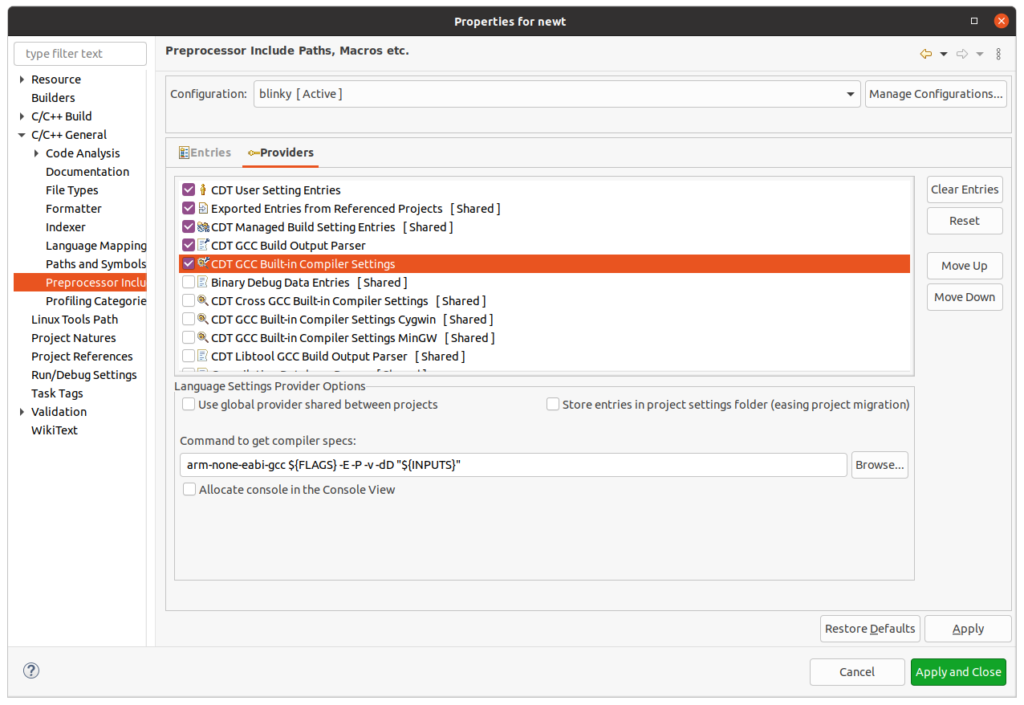
The -l debug option in the build command is important as it makes newt print debug logs during build process. These logs also include a complete command line for each command invoked. This is then used by build output parser to figure out build options for each file in the project so indexer can index file properly. The build output parser needs to be configured before it can understand debug logs from Newt:
This step is necessary only if you decided to use multiple targets, as it fixes some issues with indexing when more then one target exist in your project:
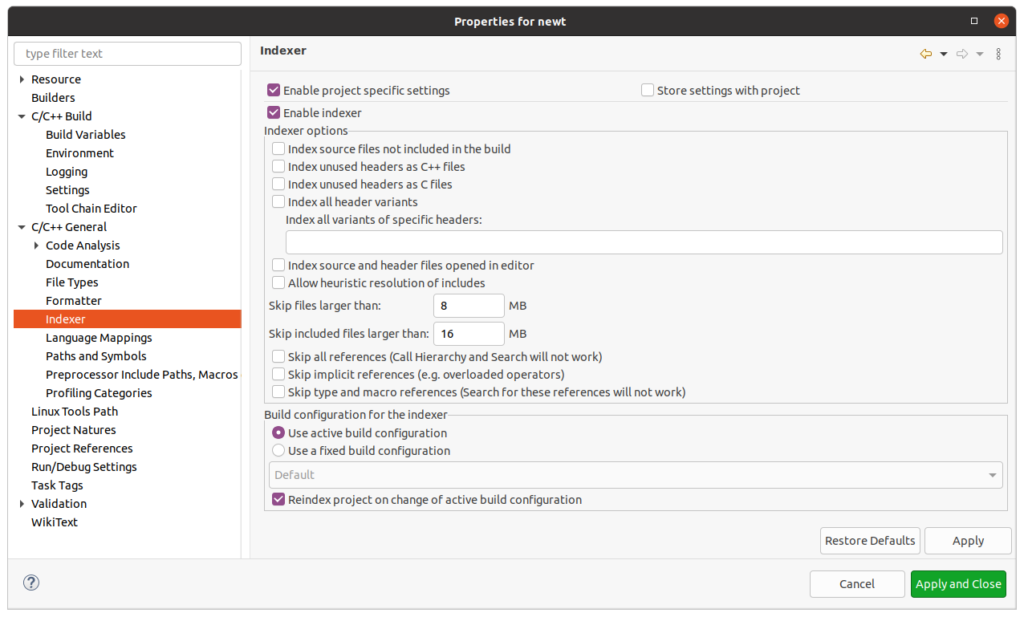
Finally, you may also tune some indexer settings to make sure only files included in the current build are indexed:
And that's all. You can build and clean (Project → Clean...) your project as any other project in Eclipse. If everything was configured properly, you should see that .c files included in the build have custom settings captured from the build output parser and this means project should be nicely indexed:
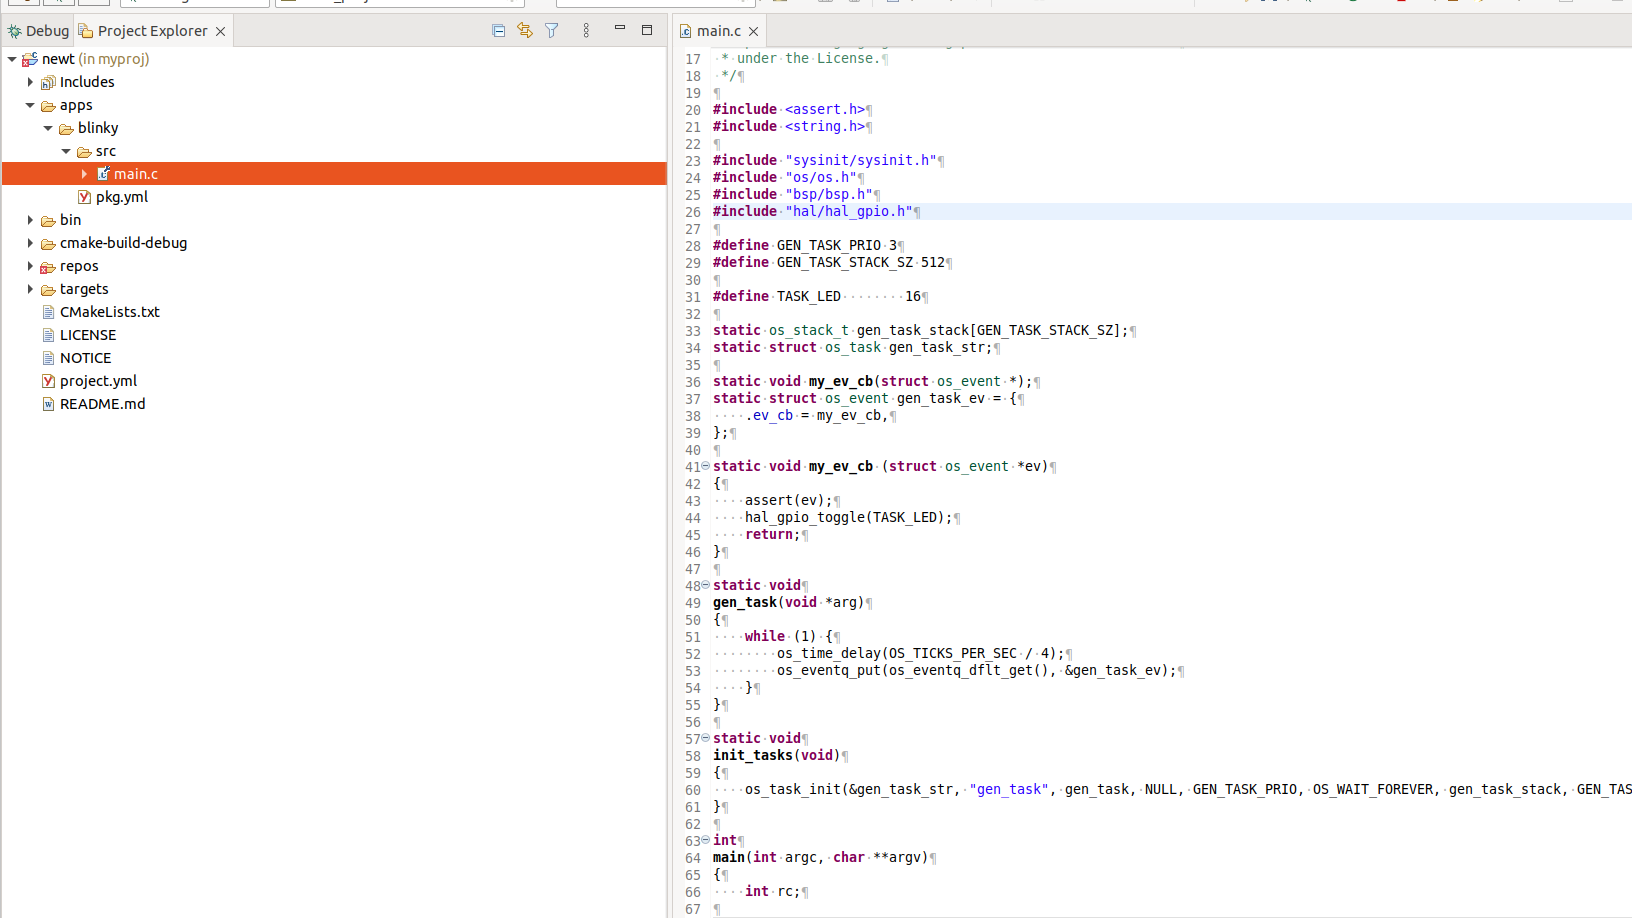
No more errors due to unresolved stuff in code 🙂
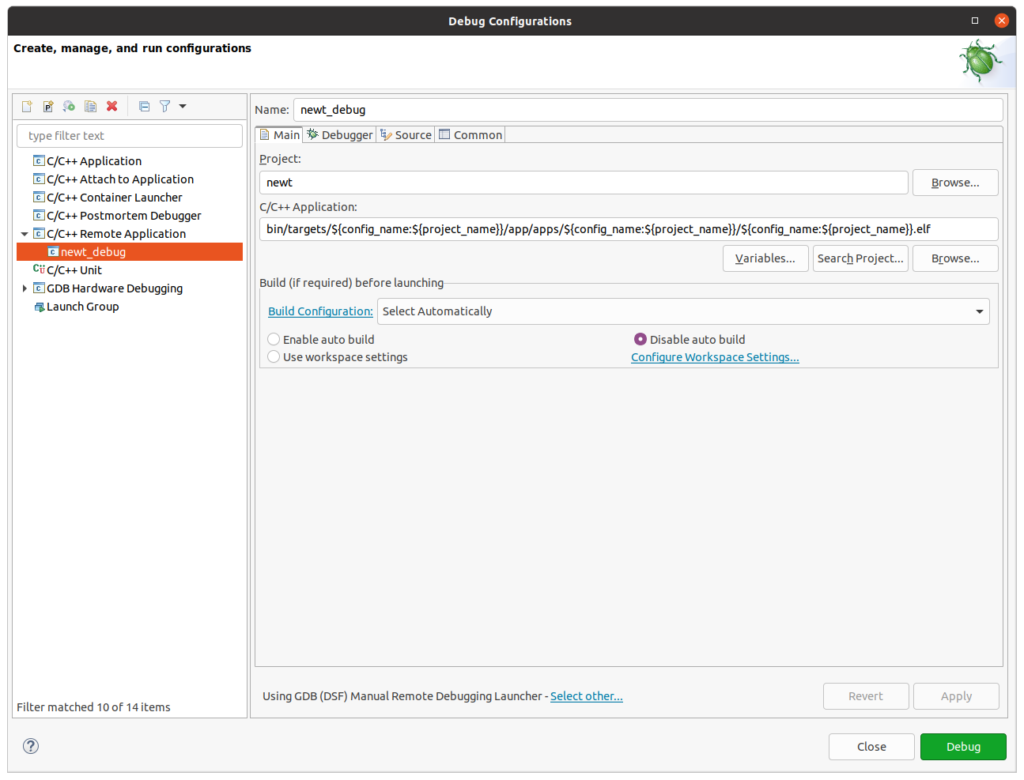
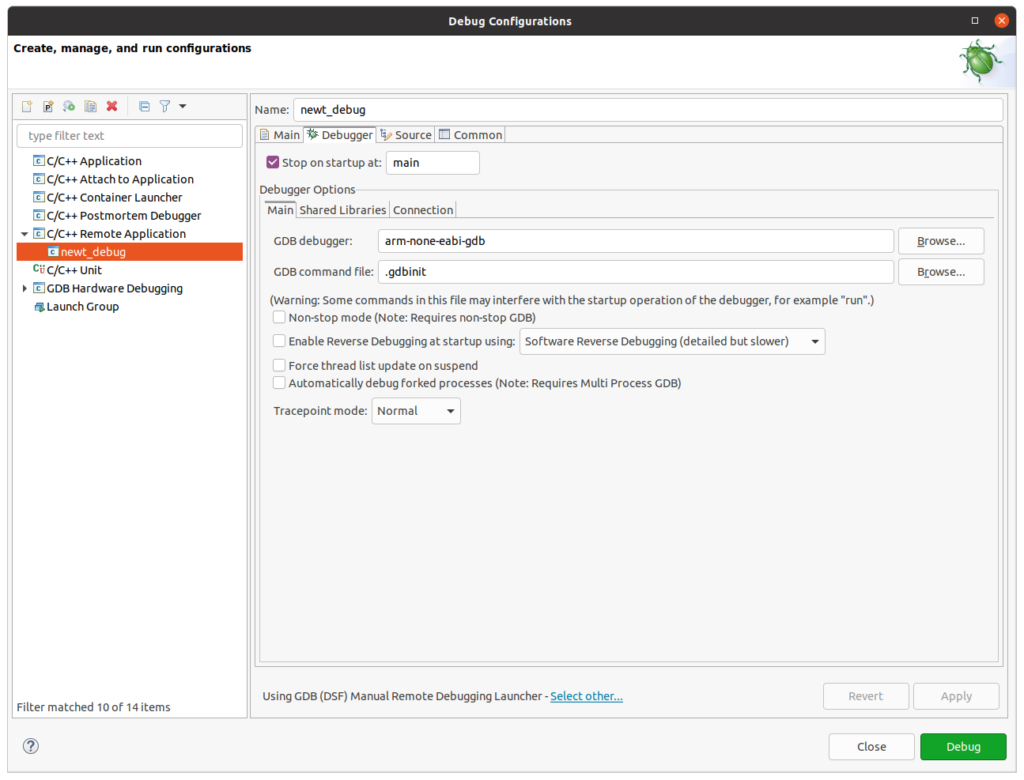
Once you can write and build your code, it is time to debug. Start with creating new debug configuration for your project:
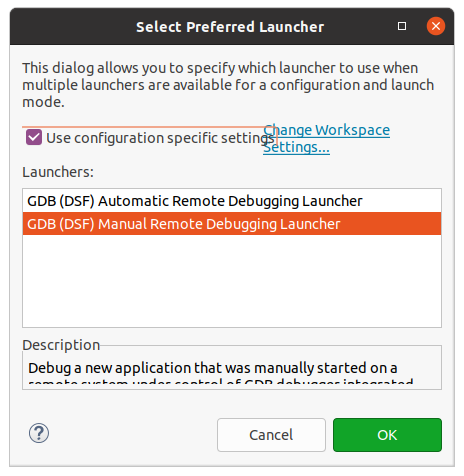
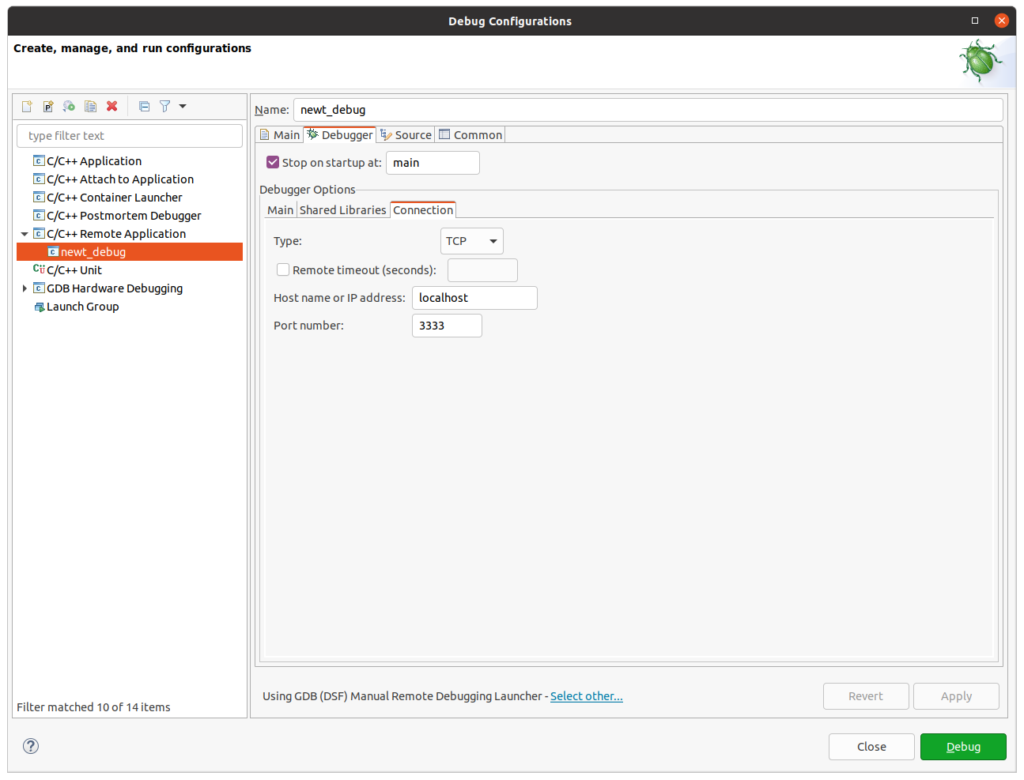
Before starting debug session in Eclipse you need to run GDB Server for selected target in shell console. This can be done in two ways:
Note the -n parameter in both cases – this will stop Newt from running GDB in shell console.
Click Debug now and you will be switched to debug session. You may now want to reset your device to start debugging from beginning. To do this use Debugger Console window and execute interrupt, monitor reset and then continue (or just suspend from UI, execute monitor reset and then continue from UI).
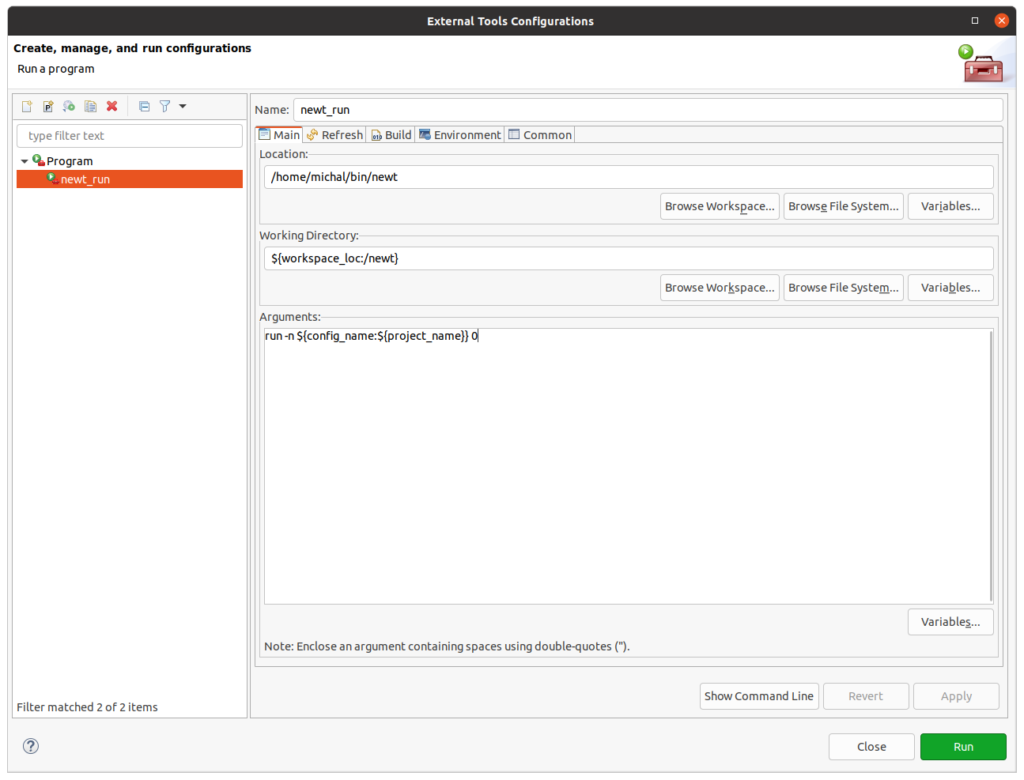
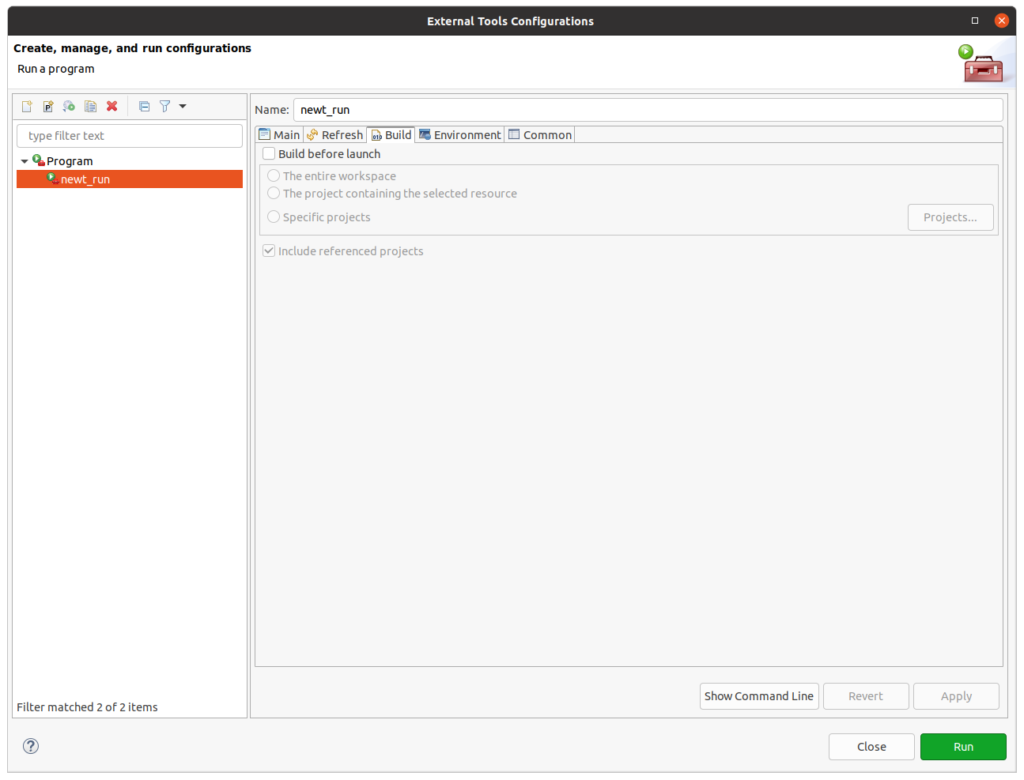
To make things even easier, it is possible to launch both newt run and debug session with a single click in Eclipse – this way you do not need to switch to shell console every time you want to start debugging. Start by creating launcher for newt run:
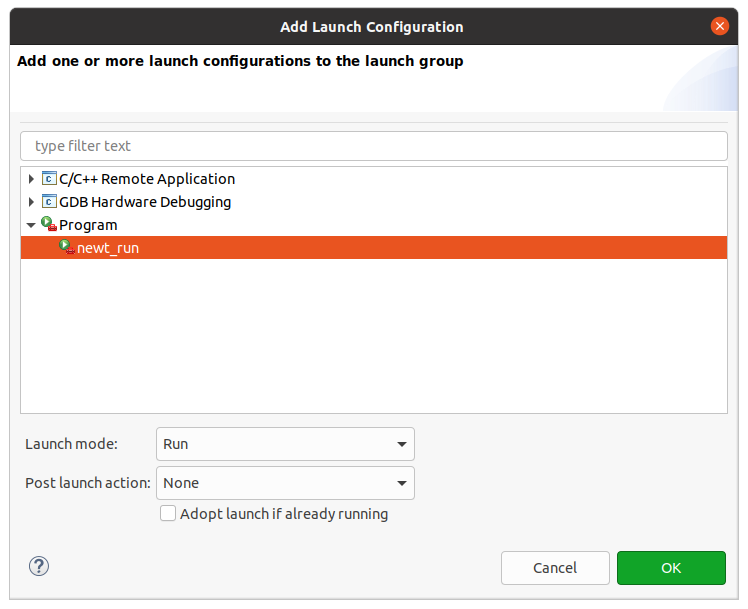
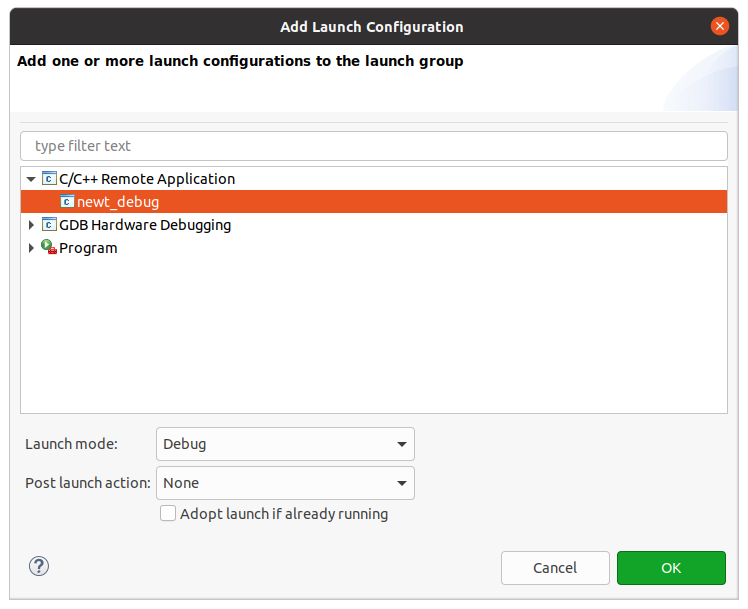
Now you just need to define launch group which runs both newt run external tool and debug configuration:
Your final setup should look as on image below:
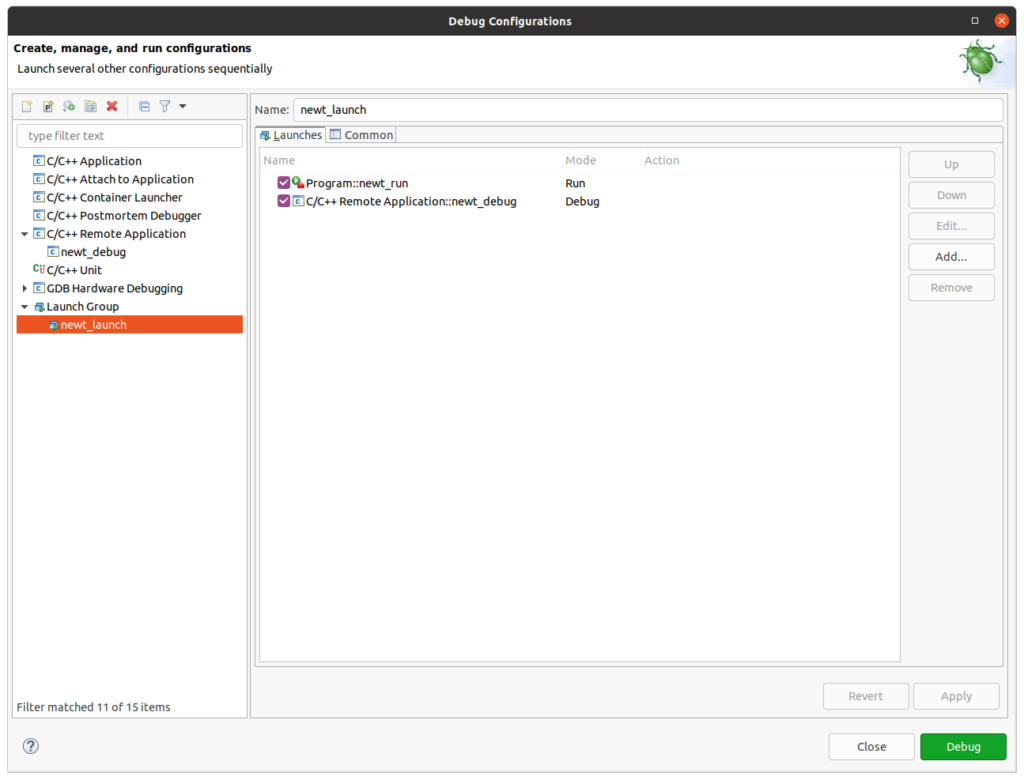
Now just use this launch group instead of plain debug configuration and you will not need to open shell when debugging Mynewt anymore 🙂